
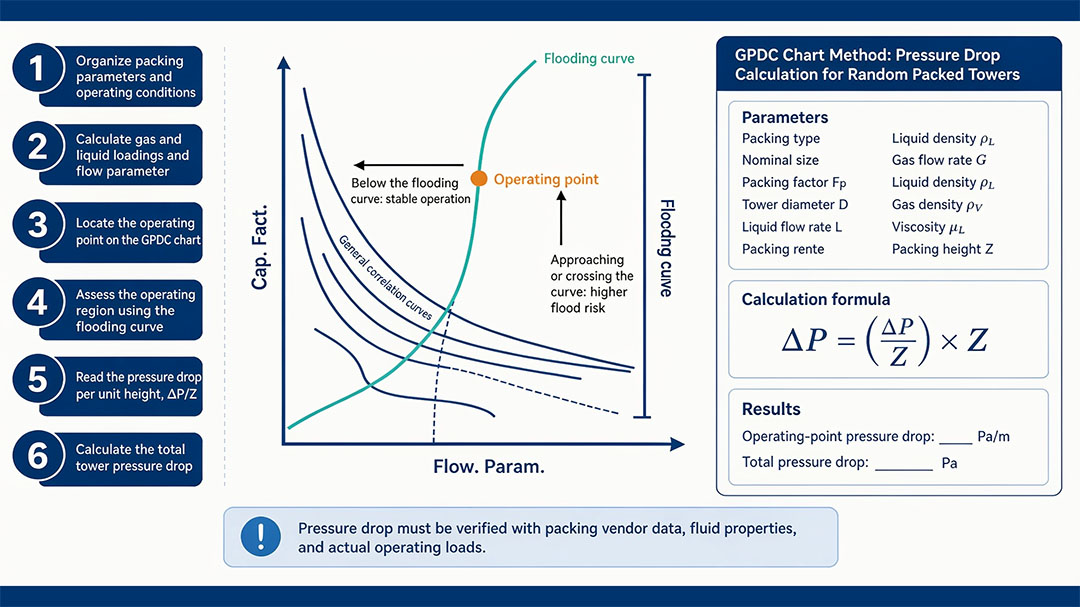
Figure 1: The GPDC chart — still the fastest way to run a packing tower pressure drop calculation before committing to a purchase.
A packing tower pressure drop calculation is the gatekeeper between a good separation and a failed one. Too high, and the fan or vacuum system can't deliver the required flow. Too low, and you may have oversized the tower or overpaid for premium packing. The good news: you can estimate pressure drop accurately enough for procurement using published correlations, a process datasheet, and 30 minutes of engineering time. This guide walks through the method that most tower designers actually use in practice.
Engineer's Brief: Pressure drop in a random packed bed is not a single number — it's a curve. It starts low at dry conditions, rises gradually as liquid loads the bed, then climbs steeply as you approach flood. Your operating point should sit well below the flood curve, typically at 40–70% of flood capacity depending on service.
The Generalized Pressure Drop Correlation (GPDC), originally developed by Eckert and later refined by Norton (now Koch-Glitsch) and others, remains the most widely used tool for random packing pressure drop estimation. It works because it normalizes the key variables into dimensionless groups that collapse diverse data onto a single chart.
On the GPDC chart, the x-axis is the liquid-to-gas ratio term and the y-axis is the pressure drop parameter: ΔP × (ρG / (ρL - ρG) × μ0.1). The flood curve typically sits at a y-value around 0.1–0.15 depending on the specific chart version. Operating points plot as dots; their vertical position relative to the flood curve tells you the margin.
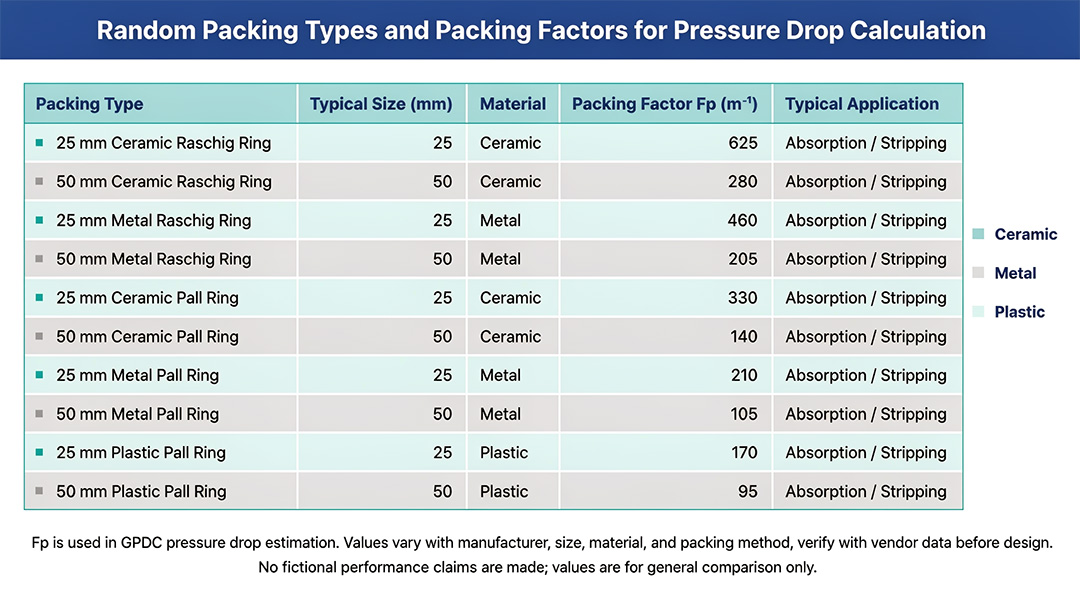
Figure 2: Packing factor (Fp) values for common random packing — the lower the number, the lower the pressure drop at the same duty.
Step 1 — Gather process data: Gas flow rate, liquid flow rate, gas density, liquid density, gas viscosity, operating temperature and pressure, tower diameter.
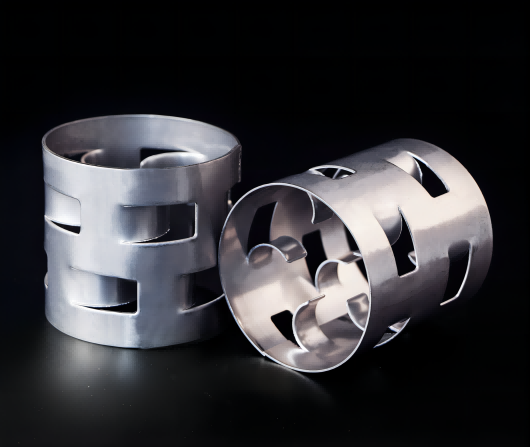
Step 2 — Select packing: Choose type and size based on service (corrosion, fouling, efficiency needs). Record the packing factor Fp from the vendor datasheet.
Step 3 — Calculate superficial velocity: u = QG / (π × D²/4), in m/s.
Step 4 — Calculate F-factor: F = u √(ρG).
Step 5 — Calculate L/G ratio term: (L/G) √(ρG/ρL).
Step 6 — Apply GPDC or vendor equation: Plot on chart or use the vendor's curve-fit equation (many publish ΔP = A × FB × (L/G)C for specific packings).
Step 7 — Check flood margin: Compare operating point to flood curve. Aim for 40–70% of flood capacity.
Step 8 — Multiply by bed height: Total ΔP = ΔP per meter × bed height (m).
Step 9 — Verify fan/vacuum capability: Confirm the system can deliver the required flow at the calculated pressure drop.
A 1.5 m ID scrubber with 50 m³/h gas (ρG = 1.2 kg/m³) and 10 m³/h water (ρL = 1000 kg/m³). Using 50 mm metal Super Raschig rings (Fp ≈ 28 m⁻¹):

| Mistake | Why it hurts | The fix |
|---|---|---|
| Using dry pressure drop only | Ignores liquid holdup, the #1 driver of ΔP in service | Always calculate at operating L/G ratio |
| Wrong packing factor | Generic Fp tables don't match modern high-performance packings | Use vendor-specific Fp or equivalent data |
| Ignoring viscosity | High gas viscosity (e.g. ethylene at pressure) shifts the curve | Apply μ0.1 correction for non-air gases |
| Overlooking distribution quality | Poor distribution creates channeling that locally spikes ΔP | Factor in distributor performance |
| No flood margin check | Operating too close to flood causes ΔP to spike unpredictably | Stay below 70% of flood capacity |
| Forgetting bed height | Per-meter ΔP looks fine but total ΔP exceeds fan rating | Always multiply by actual bed height |
Q1: How accurate is the GPDC method for procurement decisions?
A: ±15–20% when using vendor-specific packing data and correct process conditions. That's sufficient to size fans, select packing, and confirm bed height. For final hydraulic guarantee, use vendor software with measured curves.
Q2: Can I use the same calculation for structured packing?
A: The GPDC is calibrated for random packing. Structured packing uses different correlations — typically based on specific surface area and crimp angle. Use the structured packing performance factors guide for those cases.
Q3: What if my calculated ΔP is too high?
A: Options in order of preference: (1) increase tower diameter, (2) switch to a lower-Fp packing (e.g. larger size or different geometry), (3) reduce bed height by accepting more stages elsewhere, (4) accept higher fan power. Never ignore it — high ΔP at design is a guarantee of poor operation.
FXSINO supplies performance data for metal Super Raschig rings, Pall rings, saddles and other random packing with vendor-specific Fp values and GPDC curves. Send your process datasheet — we'll run the packing tower pressure drop calculation and recommend the right packing and bed height.
Email: jackieqiu9202@gmail.com | +86 18507999558
 DIRECCIÓN
: Intersection of Jinguang Avenue and Chongqing Middle Road, Anyuan Industrial Park, Anyuan District, Pingxiang City, Jiangxi
 Teléfono
: +86-18507999558
 Correo electrónico
: sales@fxsino.com
 Whatsapp
:
+86-18507999558
 Red IPv6 compatible
Mapa del sitio
| XML | Blog
| política de privacidad